
Data Observability for AI-Ready Analytics
Short answer: Data observability is the ability to monitor whether data pipelines, tables, schemas, freshness, volume, and quality are behaving as expected before broken data reaches analytics or AI systems.
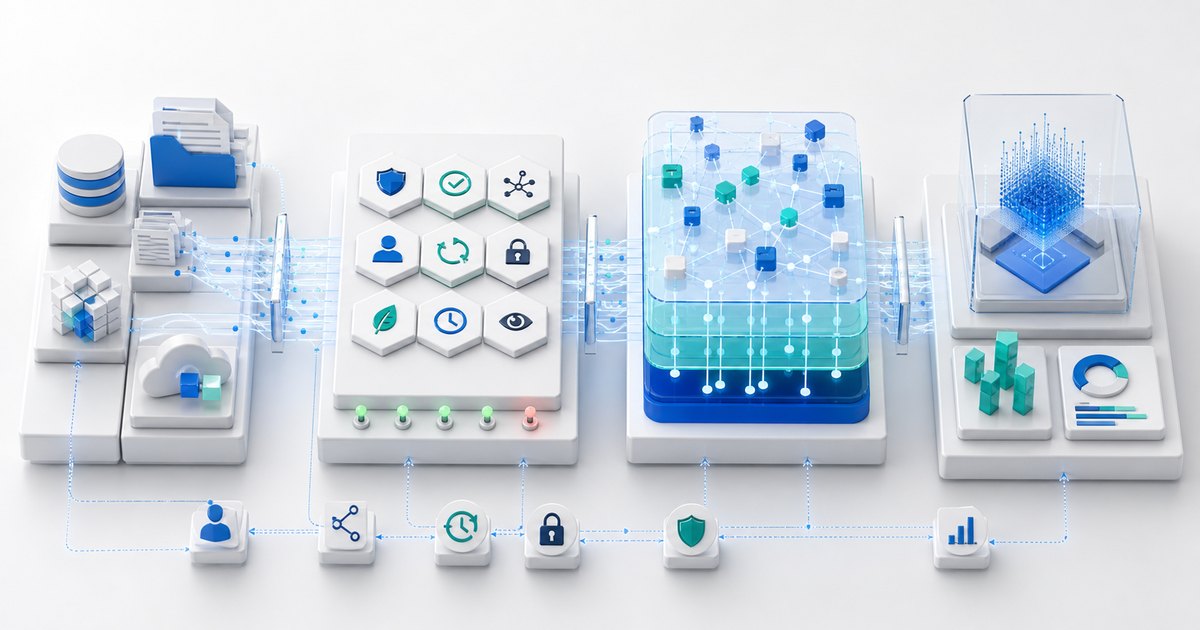
Why Observability Matters for AI
AI systems often consume data faster and with fewer manual checkpoints than traditional reporting. If a source table goes stale or a schema changes silently, the AI output may still sound confident while relying on bad context.
- Freshness monitoring.
- Schema change detection.
- Volume anomaly detection.
- Quality rule failures.
- Lineage-aware incident impact.
Core Signals to Monitor
A practical observability program starts with signals that predict user-facing failures. Monitor whether data arrived, whether it arrived in expected volume, whether required fields changed, and whether quality rules crossed thresholds.
- Freshness.
- Volume.
- Schema.
- Distribution.
- Completeness.
- Lineage.
Incident Workflow
Detection is only useful if the team can act. A good workflow identifies severity, affected assets, responsible owners, likely root cause, and whether reports or AI workflows should be paused until the issue is fixed.
- Alert routing.
- Impact analysis.
- Owner assignment.
- Root-cause tracking.
- Post-incident prevention.
Where to Start
Start with the datasets feeding executive reports, customer-facing workflows, and AI systems. These have the highest risk and create the clearest case for observability investment.
- List high-impact data products.
- Map upstream dependencies.
- Add freshness and volume checks.
- Add quality rules for critical fields.
- Review incidents monthly.
Related DataKrypton Guides
Build observability around failure modes
A monitoring tool is useful only when its signals correspond to failures that matter. Start by listing how a critical data product can fail: it can arrive late, lose records, gain duplicates, change shape, drift in distribution, violate a business rule, or become inaccessible. Map each failure to a signal and a responsible team.
Static thresholds work well for explicit promises such as a daily delivery deadline. Adaptive detection is useful for seasonal volume or distribution changes, but it still needs guardrails and review. The objective is not to detect every unusual value; it is to surface conditions that threaten a consumer.
- Freshness and end-to-end processing latency.
- Row, event, and file volume compared with expected behavior.
- Schema, type, nullability, and contract changes.
- Distribution, range, uniqueness, and business-rule failures.
- Lineage and consumer impact for triage.
A practical incident operating loop
Every alert should answer four questions: what failed, who owns it, what is affected, and what action is expected. Route incidents by data product and severity. A missing executive-risk feed deserves a different response from a delayed experimental dataset.
During resolution, preserve the detection signal, root cause, affected time window, remediation, and validation evidence. After recovery, decide whether a contract, test, deployment control, or source process should change. This converts observability from a notification stream into a reliability system.
- Acknowledge and classify the incident.
- Use lineage to identify affected reports, features, and AI workflows.
- Contain propagation and communicate consumer impact.
- Repair, backfill where necessary, and validate expected behavior.
- Record the cause and preventive control.
Observability measures for AI-ready data
Track service-level indicators for the context that reaches the AI workflow, not only the upstream warehouse table. For retrieval systems this includes document recency, parse success, chunk coverage, embedding completion, metadata-filter completeness, and access-control propagation. For predictive systems it includes feature freshness, missingness, drift, and label availability.
Useful program metrics include monitored critical products, alert precision, incidents detected before users, mean time to acknowledge, mean time to recover, repeat-incident rate, and lineage coverage. Review these with product owners so technical reliability remains connected to decision risk.
Calibrate alerts after incidents and known seasonal events. Remove noisy checks that cannot trigger action, but preserve evidence of the decision. A smaller set of trusted signals produces faster response and better adoption than a large alert inventory that teams routinely ignore.
Primary sources and technical references
Use these first-party standards and platform references to validate implementation details and current capabilities.
Frequently Asked Questions
Is data observability the same as data quality?
No. Data quality measures whether data is fit for use. Data observability monitors pipelines, tables, freshness, schema, and anomalies so teams can detect and resolve data issues faster.
What should teams monitor first?
Monitor the data products that support executive reporting, operational workflows, and AI systems. Freshness, volume, schema, and critical-field quality checks are usually the first signals to implement.